Instrumental observations over the past 157 years show that ground temperatures have risen globally, but there are large regional variations. On a global average, the warming in the last century occurred in two phases, from the 1910s to 1940s (0.35 ° C), and from the more intense 1970s to the present (0.55 ° C). The warming has accelerated over the past 25 years, and 11 of the past 12 years have been among the 12 warmest on record. Above the ground, global observations since the late 1950s have shown that the troposphere (up to 10 kilometers above the ground) has warmed slightly faster than the ground, while the stratosphere (10 to 30 kilometers above the ground) has cooled significantly since 1979. This is consistent with physical inferences and most model results. Rising ocean temperatures, rising sea levels, melting glaciers, reduced sea ice in the Arctic and reduced snow cover in the northern hemisphere are also evidence of global warming.
No thermometer can measure the global temperature. But we can estimate the average monthly global temperature using observations from thermometers at thousands of sites across the globe on land and sea surface temperature observations from ships sailing the world's oceans. In order to obtain continuous changes over time, in fact, the analysis focuses on anomalies (the difference between the observed values at each station and the climatic mean), because the accuracy of anomalies is not easily affected by changes in the data arrival rate. We have been able to use observations from 1850 to the present, but observations in the second half of the 19th century have not yet covered the globe, and the coverage has improved considerably since observations began at the South Pole in 1957, and is the best since satellite observations began around 1980.
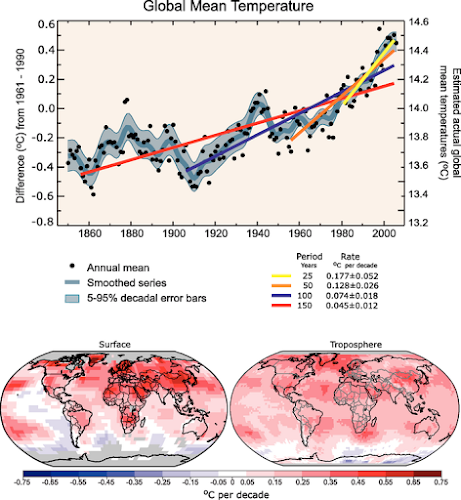
Over the past 100 years (from 1906 to 2005; As shown in Figure 1), the global average ground temperature has increased by about 0.74 ° C. However, the warming situation is unstable and different with the change of season or location. From 1850 to about 1915, except for temperature fluctuations associated with natural variability, there was no significant overall temperature change, perhaps partly as a result of the very limited availability of data. The 1910s and 1940s saw an increase in global mean temperature (0.35 ° C), followed by a slight decrease (0.1 ° C), followed by a rapid increase (0.55 ° C) until 2006 (see Figure 1). Of these, 1998 and 2005 were the warmest (both years were statistically neck and neck), while 11 of the past 12 years (1995-2006) have been among the 12 warmest. Overall, the land has warmed more than the sea, especially since the 1970s. From a seasonal point of view, winter is a little more warming. The warming of cities and urban areas is higher (often referred to as the urban heat island effect), but is confined to a certain space and has been taken into account by excluding affected sites as much as possible from the global temperature data and by increasing the margin of error (shown in gray).
Since 1901, average temperatures have fallen in a few areas, most notably in the northern North Atlantic near Greenland. During this period, the greatest warming occurred in the hinterland of Asia and the northern part of North America. However, there is a large interannual variability in these areas, so that the most obvious warming signals occur in parts of mid and low latitudes, especially in the tropical ocean. The box on the left below Figure 1 shows temperature trends since 1979. The Pacific temperature trend is characterized by areas of warming and cooling associated with Ennio.
Long-term changes in daily temperature extremes in many regions of the world (parts of southern North and South America, southern Africa and Australia) can now be analysed. In particular, these records show a decline since the 1950s in the number of very cold days and nights and an increase in the number of very hot days and warm nights (see Q&A 3.3 on Climate Change). The frost-free season is getting longer in most of the middle and high latitudes in the southern and northern hemispheres. In the Northern hemisphere, spring comes earlier.
In addition to the above earth surface data, a wide range of temperature observations above the ground have been made by sounding balloons since 1958, and satellite observations have been made since 1979. All the data are adjusted as necessary for different instrumentation and actual observation operations. Using satellite microwave data, a "satellite temperature record" of the thick atmosphere was created, including the troposphere (about 10 km from the surface) and the lower troposphere (about 10 to 30 km above the surface). Although the new analysis cross-calibrated 13 instruments on different satellites and corrected for changes in observation time and satellite height, there was still uncertainty in the temperature trend.
No thermometer can measure the global temperature. But we can estimate the average monthly global temperature using observations from thermometers at thousands of sites across the globe on land and sea surface temperature observations from ships sailing the world's oceans. In order to obtain continuous changes over time, in fact, the analysis focuses on anomalies (the difference between the observed values at each station and the climatic mean), because the accuracy of anomalies is not easily affected by changes in the data arrival rate. We have been able to use observations from 1850 to the present, but observations in the second half of the 19th century have not yet covered the globe, and the coverage has improved considerably since observations began at the South Pole in 1957, and is the best since satellite observations began around 1980.
Over the past 100 years (from 1906 to 2005; As shown in Figure 1), the global average ground temperature has increased by about 0.74 ° C. However, the warming situation is unstable and different with the change of season or location. From 1850 to about 1915, except for temperature fluctuations associated with natural variability, there was no significant overall temperature change, perhaps partly as a result of the very limited availability of data. The 1910s and 1940s saw an increase in global mean temperature (0.35 ° C), followed by a slight decrease (0.1 ° C), followed by a rapid increase (0.55 ° C) until 2006 (see Figure 1). Of these, 1998 and 2005 were the warmest (both years were statistically neck and neck), while 11 of the past 12 years (1995-2006) have been among the 12 warmest. Overall, the land has warmed more than the sea, especially since the 1970s. From a seasonal point of view, winter is a little more warming. The warming of cities and urban areas is higher (often referred to as the urban heat island effect), but is confined to a certain space and has been taken into account by excluding affected sites as much as possible from the global temperature data and by increasing the margin of error (shown in gray).
Since 1901, average temperatures have fallen in a few areas, most notably in the northern North Atlantic near Greenland. During this period, the greatest warming occurred in the hinterland of Asia and the northern part of North America. However, there is a large interannual variability in these areas, so that the most obvious warming signals occur in parts of mid and low latitudes, especially in the tropical ocean. The box on the left below Figure 1 shows temperature trends since 1979. The Pacific temperature trend is characterized by areas of warming and cooling associated with Ennio.
Long-term changes in daily temperature extremes in many regions of the world (parts of southern North and South America, southern Africa and Australia) can now be analysed. In particular, these records show a decline since the 1950s in the number of very cold days and nights and an increase in the number of very hot days and warm nights (see Q&A 3.3 on Climate Change). The frost-free season is getting longer in most of the middle and high latitudes in the southern and northern hemispheres. In the Northern hemisphere, spring comes earlier.
In addition to the above earth surface data, a wide range of temperature observations above the ground have been made by sounding balloons since 1958, and satellite observations have been made since 1979. All the data are adjusted as necessary for different instrumentation and actual observation operations. Using satellite microwave data, a "satellite temperature record" of the thick atmosphere was created, including the troposphere (about 10 km from the surface) and the lower troposphere (about 10 to 30 km above the surface). Although the new analysis cross-calibrated 13 instruments on different satellites and corrected for changes in observation time and satellite height, there was still uncertainty in the temperature trend.
From global observations since the late 1950s, the most recent data set shows that the troposphere has warmed slightly faster than the ground, while the stratosphere has cooled significantly since 1979. This is consistent with physical inferences and most model results showing that increased concentrations of greenhouse gases play a role in both tropospheric warming and stratospheric cooling. Ozone depletion also plays a big role in cooling the stratosphere.

Figure 1: (above) : Observed global average annual temperature (black spot) and a simple fitting with the data. The axis on the left shows the distance from the 1961-1990 average, while the axis on the right shows the estimated actual temperature (℃). The chart shows a linear trend fitting over the past 25 years (yellow), 50 years (orange), 100 years (purple) and 150 years (red), corresponding to 1981-2005, 1956-2005, 1906-2005 and 1856-2005, respectively. Note that the shorter the recent time period, the greater the gradient, indicating an accelerating temperature rise. The blue curve is a smooth representation of decadal changes. To get the meaning of these fluctuations, the line is given an error interval of 5-95% (light gray) every 10 years (so that the values exceed these limits every year). Calculations using an estimated 20th century radiation-forced-driven climate model show little change until about 1915, with most of the early 20th century changes attributable to natural influences such as solar radiation changes, volcanic eruptions and natural variability. From about 1940 to 1970, rapid industrialization and the ensuing World War II increased pollution in the Northern Hemisphere, resulting in cooling. After the mid-1970s increases in carbon dioxide and other greenhouse gases dominated the observed warming. (below) A linear global temperature trend from 1970 to 2005 estimated from satellite records, with ground temperature trends on the left and tropospheric temperature trends on the right up to about 10 km. The gray area indicates incomplete data. Note that if there is a more consistent warming in the tropospheric satellite record as the surface temperature changes, then the relationship between this warming and the land and ocean is even more pronounced. (From HadCRUT3 data Set)
Consistent with the observed increase in surface temperatures, the river and lake ice ages shortened. In addition, in the 20th century, glacier quality and surface volume decreased almost all over the world. The melting of the Greenland ice sheet has become more apparent recently; In many parts of the northern hemisphere, snow cover has decreased; The thickness and area of Arctic sea ice decrease in all seasons, with the most severe in spring and summer. The oceans are warming; Sea levels are rising because of the thermal expansion of the oceans and the melting of land ice.
Consistent with the observed increase in surface temperatures, the river and lake ice ages shortened. In addition, in the 20th century, glacier quality and surface volume decreased almost all over the world. The melting of the Greenland ice sheet has become more apparent recently; In many parts of the northern hemisphere, snow cover has decreased; The thickness and area of Arctic sea ice decrease in all seasons, with the most severe in spring and summer. The oceans are warming; Sea levels are rising because of the thermal expansion of the oceans and the melting of land ice.
Comments
Post a Comment